Visualizing Crash Data in Buzilla
Since joining the Platform Graphics team as a QA engineer several months ago I’ve dabbled in visualizing Graphics crash data using the Socorro supersearch API and the MetricsGraphics.js visualization library.
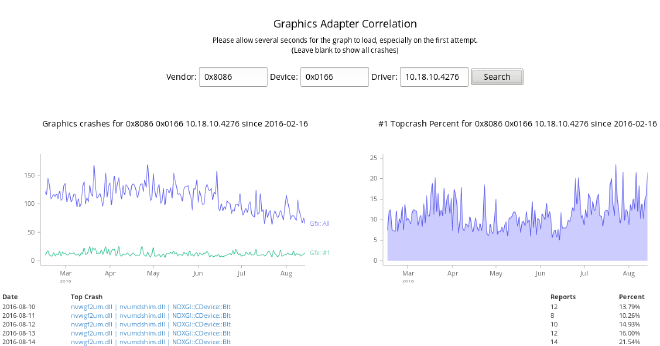
After I gained a better understanding of the API and MG.js I set up a github repo as sandbox to play around with visualizing different types of crash data. Some of these experiments include a tool to visualize top crash signatures for vendor/device/driver combinations, a tool to compare crash rates between Firefox and Fennec, a tool to track crashes from the graphics startup test, and a tool to track crashes with a WebGL context.
Fast forward to June, I had the opportunity to present some of this work at the Mozilla All-hands in London. As a result of this presentation I had a fruitful conversation with Benoit Girard, fellow engineer on the Graphics team. We talked about integrating my visualization tool with Bugzilla by way of a Bugzilla Tweaks add-on; this would both improve the functionality of Bugzilla and improve awareness of my tool. To my surprise this was actually pretty easy and I had a working prototype within 24 hours.
Since then I’ve iterated a few times, fixing some bugs based on reviews for the AMO Editors team. With version 0.3 I am satisfied enough to publicize it as an experimental add-on.
Bugzilla Socorro Lens (working title) appends a small snippet into the Crash Signatures field of bug reports, visualizing 365 days worth of aggregate crash data for the signatures in the bug. With BSL installed it becomes more immediately evident when a crash started being reported, if/when it was fixed, how the crash is trending, or if the crash is spiking; all without having to manually search Socorro.
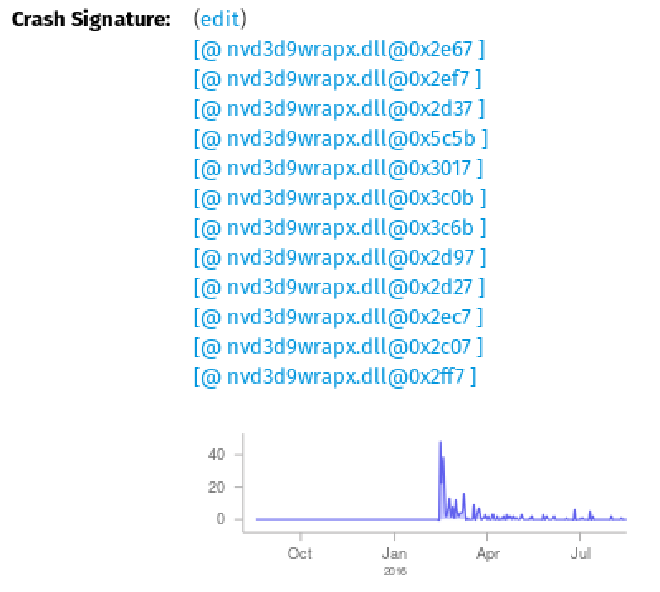
Of course if you want to see the data in Socorro you can. Simply click a data-point on the visualization and a new tab will be opened to Socorro showing the crash reports for that date. This is particularly useful when you want to see what may be driving a spike.
At the moment BSL is an experimental add-on. I share it with you today to see if it’s useful and collect feedback. If you encounter a bug or have a feature request I invite you to submit an issue on my github repo. Since this project is a learning experience for me, as much as it is a productivity exercise, I am not accepting pull requests at this time. I welcome your feedback and look forward to improving my coding skills by resolving your issues.
You can get the add-on from addons.mozilla.org.
Update: Nicholas Nethercote informed me of an issue where the chart won’t display if you have the “Experimental Interface” enabled in Bugzilla. I have filed an issue in my github repo and will take a look at this soon. In the meantime, you’ll have to use the default Bugzilla interface to make use of this add-on. Sorry for the inconvenience.